The Weekend Wonder - GBP/USD
Hi all, and I hope your weekend has been a good one!
Doing my usual review of trades, and charts for the upcoming week, I thought I would jot down some thoughts on a set up possibly approaching on many traders favourite pair, the cable, or the GBP/USD. For those that don't trade it, it is my favourite simply due to it's volitility, with daily ranges on the cable usually being greater than most other pairs. Of course this means you need to give trades more room, but it also means the potential profits are greater.
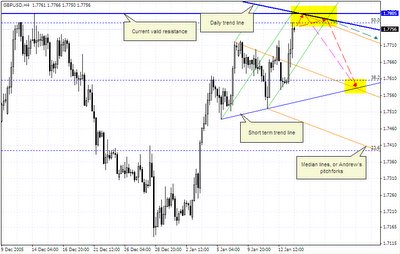
Ok let's take a look at what is happening. Here is the 4H chart of the cable:
There are four main features of this chart that interest me. The first is the daily trend line, which you can see sloping downwards at the top of the chart, showing that actually, despite the recent rises, long term we are still in a downtrending pattern. The second feature is the previous high that is our current resistance, the third in green, the Andrew's Pitchfork (or median lines, theory article to come on that soon) and finally the 50.0 fibonacci level from 5th of Jan's high. What interest me the most is the area of confluence (confluence is the points where differnt lines meet or intersect) between these four features, along with the round number in this area of 1.7800.
I will be monitoring early trading closely to see if this area, around 1.7800 holds prices, there are a lot of factors to hold the price around this level, and if the signs are good, I'll be loading up on a short somewhere under that 800 mark, a stop loss above the previous high and a target at the 4H trend line.
Watch for a weekend gap in prices, if it gaps up to the area of confluence on Monday opening, that will be another confirmation signal for me, as often weekend gaps are covered in early Asian session trading. From there I expect a move back to the short term trend line, which combine with the daily trend line, is forming a nice triangle, something else to look at come Tuesday most likely where a breakout of the formation might be seen.
If all this proves correct? .. probably a trade around +100 to +200 closed sometime Tuesday, if not, well at least the analysis was thorough, even if it wasn't correct ;), and it's failure might indicate a long position has been confirmed instead.
Ok good luck for the week!
Happy trading!

Posted byMonday, January 16, 2006 2:23:00 AM
Great Analysis. I also think 1.7800 should be a strong resistance for next week.GBP/USD probably will retrace down before going up again.
» Post a Comment