Trading Tools: Fibonacci Grouping
Hi all! and welcome to the first in a series of articles I am calling "Trading Tools", where I will look at bite size pieces of technical analysis that might help you in your trading. I don't intend these to complete trading systems, but rather different ways you can use the many tools that are out there to help you in your trading system development.
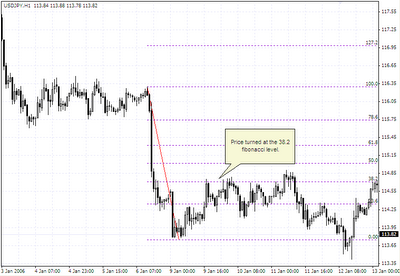
I will start things off with Fibonacci Grouping. I have written a Theory article on Fibonacci before, if you are not familiar with what Fibonacci is, it is probably best to have a read of that article here before moving on. The common use of Fibonacci levels is to find where prices may retrace to, the most common retracement levels used being 23.6, 38.2, 50.0 and 61.8. Just as a refresher, here again is what a chart might look like with fibonacci lines on it:
No two traders are ever the same, even if they use the same tools, the way they interpret a chart will always be different, that is what makes us human. If we take a group of fibonacci traders, the main difference you will find apart from their interprative skills and perhaps their haircut, will be the timeframe they trade off. One might trade of a 1H chart, looking for a turn at the 1H 38.2 fibonacci level, while Joe Blog next to him is trading off the daily charts, looking for a move to the daily 38.2 level. So how can we use this to our advantage? Let's look at the current USD/JPY chart again, using three hypothetical traders for our example:
Scenario: Trader 1 likes to day trade off the 1H charts, trader 2 like looking at the 4H charts, and trader 3 is a swing trader of the daily charts. All three traders use price action, trend lines and fibonacci to trade.
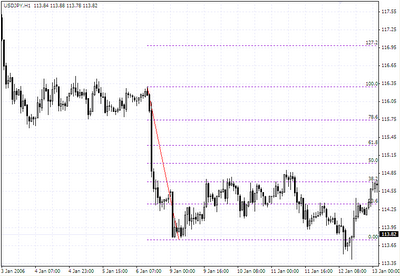
Ok here is the USDJPY chart as of this minute again, lets look at what each trader sees, first trader 1 who uses 1H charts:
... now trader 2, who looks at the 4H charts:
I will start things off with Fibonacci Grouping. I have written a Theory article on Fibonacci before, if you are not familiar with what Fibonacci is, it is probably best to have a read of that article here before moving on. The common use of Fibonacci levels is to find where prices may retrace to, the most common retracement levels used being 23.6, 38.2, 50.0 and 61.8. Just as a refresher, here again is what a chart might look like with fibonacci lines on it:
USD/JPY 1H
This is this the USD/JPY chart as of the minute I am writing this article, and you can see price is approaching that same level again, it will be interesting to see what happens at this resistance level.
No two traders are ever the same, even if they use the same tools, the way they interpret a chart will always be different, that is what makes us human. If we take a group of fibonacci traders, the main difference you will find apart from their interprative skills and perhaps their haircut, will be the timeframe they trade off. One might trade of a 1H chart, looking for a turn at the 1H 38.2 fibonacci level, while Joe Blog next to him is trading off the daily charts, looking for a move to the daily 38.2 level. So how can we use this to our advantage? Let's look at the current USD/JPY chart again, using three hypothetical traders for our example:
Scenario: Trader 1 likes to day trade off the 1H charts, trader 2 like looking at the 4H charts, and trader 3 is a swing trader of the daily charts. All three traders use price action, trend lines and fibonacci to trade.
Ok here is the USDJPY chart as of this minute again, lets look at what each trader sees, first trader 1 who uses 1H charts:
USD/JPY 1H

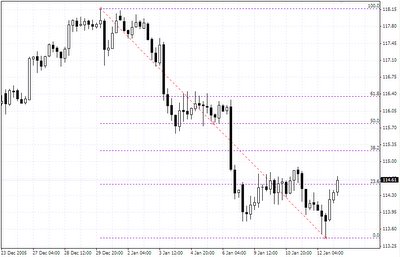
... now trader 2, who looks at the 4H charts:
USD/JPY 4H

... and finally trader 3, who looks at the daily charts:
USD/JPY DAILY
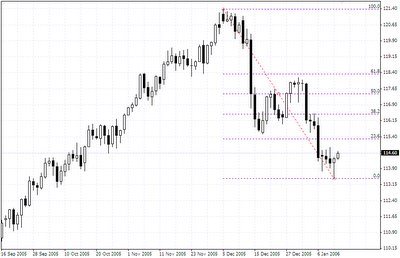

If we look at the above charts, you will see, for trader 1, the price has moved passed the 38.2, and is heading towards the 50.0 level again, for trader 2, it is around the 23.6 level on the 4H chart, and for trader 3, we are still moving towards the 23.6 level on the daily chart. So how do we know which level on which time frame would be the right place to look for a turn in the price? What we want to do is take all of these traders views and place them on the one chart. If we took trader1, trader2 and trader3's fibonacci level and placed them all onto trader 1's chart, here is what it would look like as of now:
USD/JPY 1H
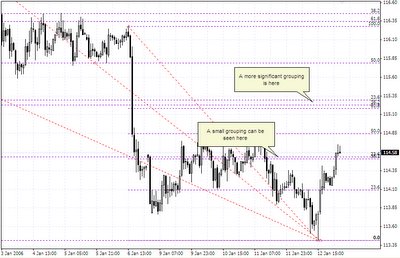

You can see two areas are marked, where the fibonacci lines from the different timeframes are sitting in roughly the same area. These are the areas I refer to when I say Fibonacci grouping. These areas are significant, because they are areas of "common ground" where traders from different timeframes all have a significant level to look at. You can see price has just pushed through an areas where the 1H 38.2 and the 4H 23.6 level was, if it can move away from this area, then the next major area of grouping is where the 1H 61.8, 4H 38.2 and the Daily 23.6 lines all sit in roughly the same area. If it can't move past that first grouping ... well point proven.
If you are in a long position (as I am currently from 113.62) then any of these two areas might be a good profit taking opportunity, or, if you are looking for somewhere to go short, then that is a good area to look for weakness in the move up.
While not foolproof by any means (nothing ever is in trading), grouping can tell you areas where traders of all timeframes might be thinking hard about the future of the current move. The greater number of people pausing to think, the greater chance things will turn around, as most people like change. If a pause is long enough, doubt's will creep in and things might turn based on fear alone. Remember, trading is as much about psychology and emotion as it is about economic data, so if you can get a hint into the emotion of a market, you can get a head start on most.
Fibonacci grouping can be a nice way to look for entries as well as exits, so, if Fibonacci is your thing, then this might be a nice little tool for you to use.
Happy trading!
If you are in a long position (as I am currently from 113.62) then any of these two areas might be a good profit taking opportunity, or, if you are looking for somewhere to go short, then that is a good area to look for weakness in the move up.
... the greater number of people pausing to think, the greater chance things will turn around, as most people like change ...
While not foolproof by any means (nothing ever is in trading), grouping can tell you areas where traders of all timeframes might be thinking hard about the future of the current move. The greater number of people pausing to think, the greater chance things will turn around, as most people like change. If a pause is long enough, doubt's will creep in and things might turn based on fear alone. Remember, trading is as much about psychology and emotion as it is about economic data, so if you can get a hint into the emotion of a market, you can get a head start on most.
Fibonacci grouping can be a nice way to look for entries as well as exits, so, if Fibonacci is your thing, then this might be a nice little tool for you to use.
Happy trading!
Posted byFriday, January 13, 2006 10:54:00 PM
Thanks for the lesson. I learn one more new technique today. :D
Posted by
Friday, January 13, 2006 11:02:00 PM
Hope it helps :)
Posted by
Friday, January 13, 2006 11:15:00 PM
I have a question,your example show that u draw all 3 fibo lines from high to low,that's mean all same direction. Can we draw several fibo lines with mix direction?
Posted by
Friday, January 13, 2006 11:49:00 PM
great article Akuma!
Still waiting for the article regarding your views on price action.... :P
Posted by
Saturday, January 14, 2006 1:52:00 AM
phildunn, yes they should all be drawn in the same direction :)
sos, this weekend I will start a weekend analysis series, where I will look back at the weeks trades, and look at how things are set up for Monday trading, I hope this will be what you need :)
Posted by
Saturday, January 14, 2006 3:40:00 AM
Thanks Akuma,
I'm eager to see you ways. Cause I've been through loads of indicators and everything, with no luck. But since a month ago I am trading mainly with price action (text book price patterns) and I like my results so far...
» Post a Comment