The Pointless Quest For Perfection
Hi all!! and I hope your trading days have been profitable ones!
Wow what a few days, delving completely into the Stormy indicator, it has been an interesting experience to see if I could get an indicator together that would be profitable, easy to use and based on direct price action and volitility rather than averaging this, smoothing that etc.
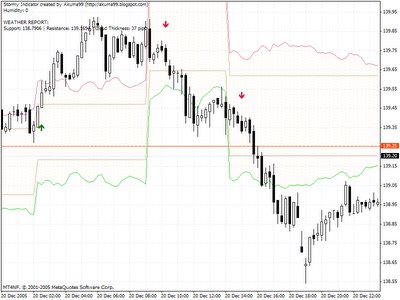
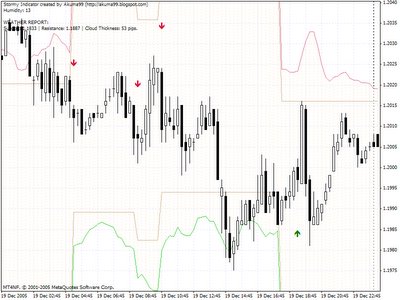
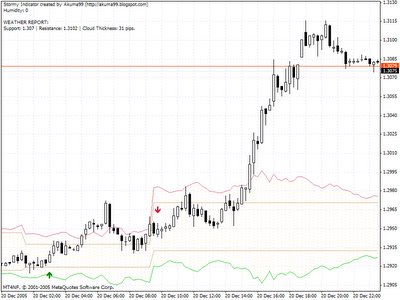
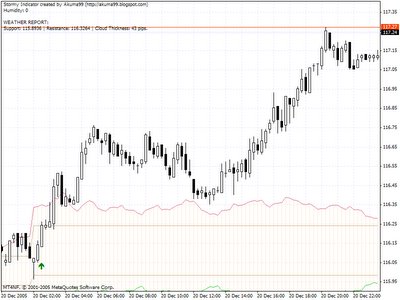
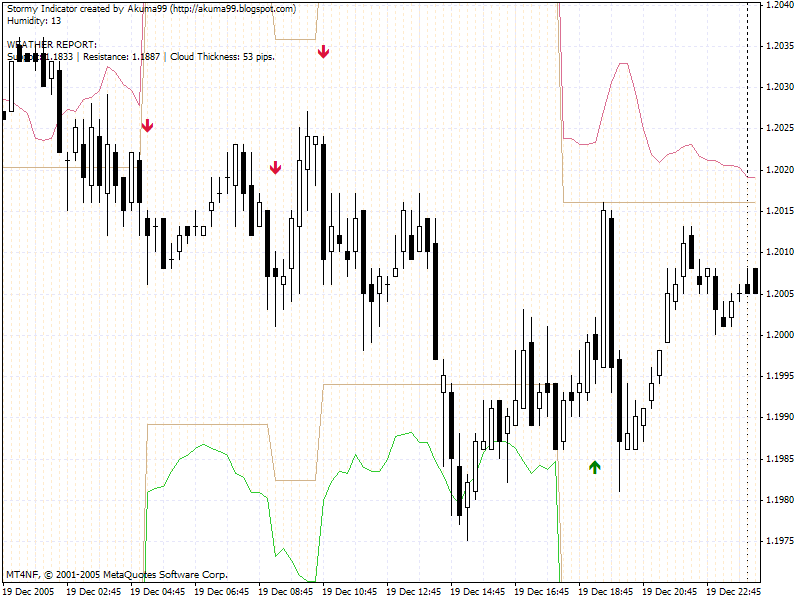
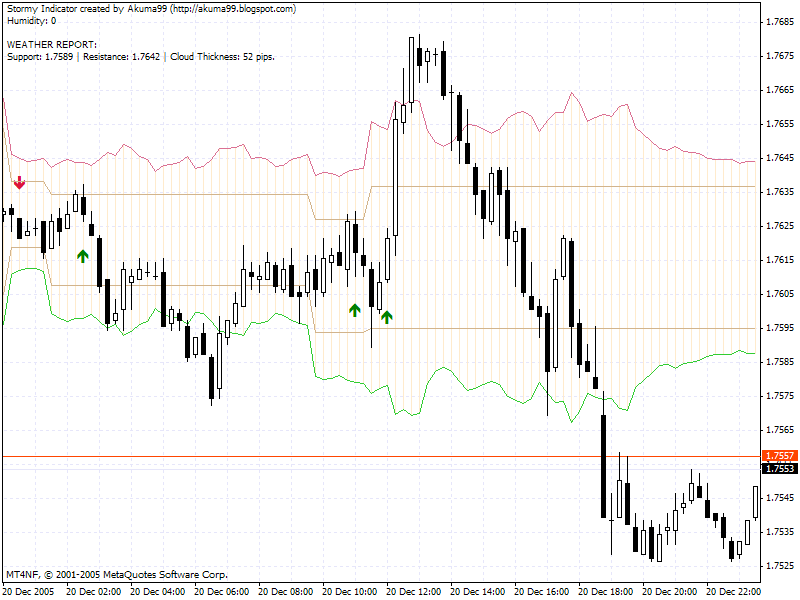
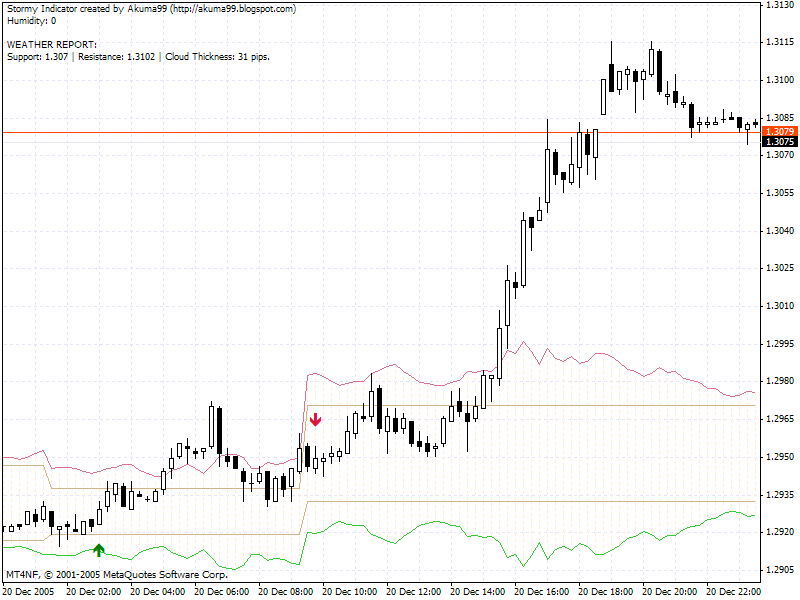
Things are close, and I am starting to think that close is good enough. I think we all would love that "perfect" indicator that would give 100% correct signals and have us living the easy life. It has become apparent to me that, like all things in this world, nothing is perfect, and what is more important is how you manage an indicators signals rather than the signals themselves (within reason). The good news is Stormy tends to give fairly good signals, and with a proper trading strategy as it's foundation, I truly believe it could be a profitable system. To show you were it is at, here are the charts of the five pairs I favour from yesterday:
Wow what a few days, delving completely into the Stormy indicator, it has been an interesting experience to see if I could get an indicator together that would be profitable, easy to use and based on direct price action and volitility rather than averaging this, smoothing that etc.
Things are close, and I am starting to think that close is good enough. I think we all would love that "perfect" indicator that would give 100% correct signals and have us living the easy life. It has become apparent to me that, like all things in this world, nothing is perfect, and what is more important is how you manage an indicators signals rather than the signals themselves (within reason). The good news is Stormy tends to give fairly good signals, and with a proper trading strategy as it's foundation, I truly believe it could be a profitable system. To show you were it is at, here are the charts of the five pairs I favour from yesterday:
EUR/JPY
EUR/USD
GBP/USD

USD/CHF
USD/JPY

EUR/USD
GBP/USD
USD/CHF
USD/JPY
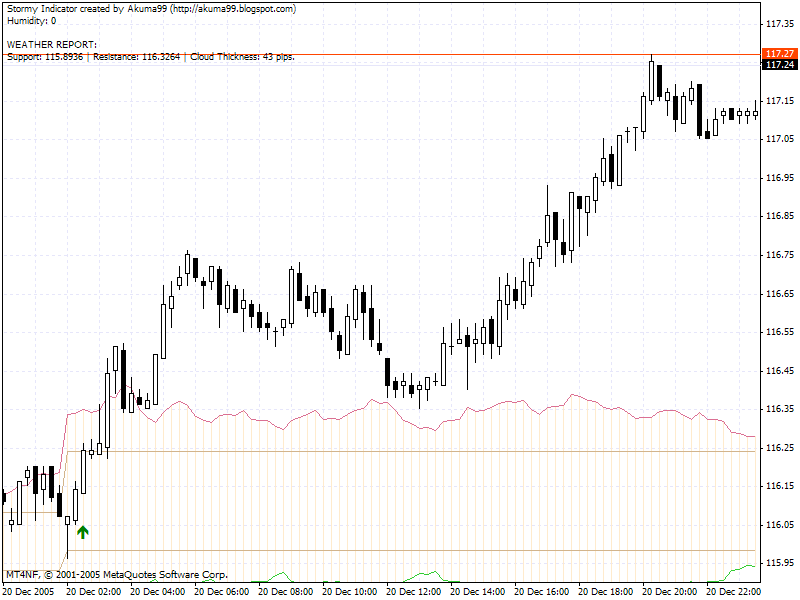
You can see it is a real mixed bag, it is reasonably successful in predicting a big move, the arrows are an attempt to catch the moves early on, which yesterday got it right 71% of the time. However back this up with the method I spoke about the other day, where we go long on a close above the cloud, short on a close below it, and the 29% of losing trades could have been countered by a trade in the opposite direction soon after. Now rather than trying to do what I think may be impossible, that is predicting every direction correctly, I think we may be able to overcome this with smart money management and clever trading system built around it.
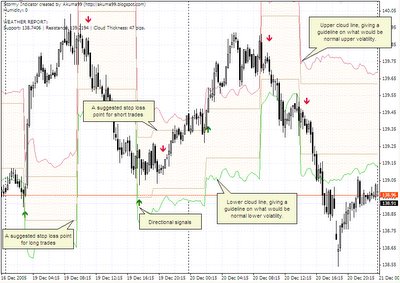
Now the challenge for me and you if you wish it to be is, from the above charts, is there a solid trading system that could form the basis of this indicator?, I would love to hear any innovative ideas, and to help you, below is a chart with explanations on what everything means. There has been some very innovative thoughts in the comments section here so would love to hear other ideas as we move forward and get this public.
Thanks for all the kind words so far, things are moving in the right direction, but without trading rules, exit strategy and money management plan, no indicator will make money so that will be the next step.
Happy trading!
Now the challenge for me and you if you wish it to be is, from the above charts, is there a solid trading system that could form the basis of this indicator?, I would love to hear any innovative ideas, and to help you, below is a chart with explanations on what everything means. There has been some very innovative thoughts in the comments section here so would love to hear other ideas as we move forward and get this public.

Thanks for all the kind words so far, things are moving in the right direction, but without trading rules, exit strategy and money management plan, no indicator will make money so that will be the next step.
Happy trading!
This entry was posted
on Wednesday, December 21, 2005 at 9:01:00 AM.
You can skip to the end and leave a response.
![]()
![]()
Posted byWednesday, December 21, 2005 5:47:00 PM
Just going to throw some ideas at you and let you do all the work seeing if they are feasible or not :-)
Bollinger bands have a cousin called %b. %b gives the exact location of the price relative to the bands.
A value of 1.0 means the price is exactly at the upper bollinger line. Above 1.0 and the price is above that line.
A value of 0.0 means the price is exactly at the lower bollinger line. Below 0.0 and the price is below that line.
(The values rarely go outside -0.3 or 1.3).
0.5 means the price is exactly in the middle.
If you could create some calculation to give you the same kind of figure with Stormy Weath (let's call it %sw), then:
I thought of using the midpoint, that is where %sw = 0.5 - go long above 0.5 and short below 0.5.
But, that's wide open to whipsaw. So maybe above 0.8 go long, below 0.2 go short.
You could then use 0.5 as the stop loss for both long and short.
Or, have an "always in" system where you go long at 0.8 and set stop loss at 0.2. And short at 0.2 and set stop loss at 0.8.
Does any of that make sense?
Sharky
www.thinkingstuff.com
Posted by
Wednesday, December 21, 2005 6:34:00 PM
Thought I should clarify.
A simple trading system using Stormy Weather, more particular %sw (which I leave to you to work out how to calculate :-)
- Work out where the price would be for %sw to equal 0.8 and 0.2 (of course these two figures could be adjusted to 1.0 and 0.0, 0.7 and 0.3, whatever).
- Work out where the price would be for %sw to equal 0.5.
- If the price closes above where %sw = 0.8 then enter long. Set initial stop loss to the price where %sw would equal 0.5.
- If the price closes below where %sw = 0.2 then enter short. Set initial stop loss to the price where %sw would equal 0.5.
- Every bar, recalculate Stormy Weath and the %sw values. If necessary, move the stop loss so it always stays where %sw = 0.5. But only move it if we are decreasing the risk in the trade.
- Eventually the price will take out the stop loss. Hopefully by the time it does so, the stop loss is above the point where we got in.
Looking at the charts you've posted, it looks like this system would still have an open trade for most currencies, but the stop loss would not have moved very far at all.
However, I've noticed that sometimes Stormy Weather suddenly makes a great jump. This would take the %sw values with it, and lock in a boat load of profit.
Of course there will be times when it doesn't, and we are taken out with the modest profit/loss. The question is, do our big profits make more than the little losses? If yes then it's a good system, if not then don't trade it. Easy :-)
Was this the kind of idea you were looking for? I hope others post their thoughts as well.
Posted by
Wednesday, December 21, 2005 7:20:00 PM
Hi sharky, and a huge thanks for those ideas! Funnily enough, the charts you see employ a similiar, although not identical method to what you describe, in those charts, the indication is given by the midpoint of the candle when a decision signal is given by Stormy. If the midpoint is above what you label as 0.5 then we are long, below 0.5 we are short.
Your ideas though are a great idea and certainly worth investigating, so no doubt I will be spending tonight programming the %sw ;)
Really fantastic suggestion, exactly the type of ideas I am looking for, I'll be sure to post the progress of this idea tomorrow.
Thanks again!
Posted by
Wednesday, December 21, 2005 9:20:00 PM
Great! Please send me lots of money :-)
But here's another thing to be careful of in your backtesting.
As I mentioned, sometimes Stormy seems to jump to an entirely different level. And this is good as it would lock in a bunch of profit.
However, and I'm sure you've thought of this case already in your backtesting, but...
The system has an open long trade, and we get a new bar. You calculate Stormy and it suddenly does one of those jumps.
Now you calculate %sw and find that the price is actually already below 0.5. Because of the jump. (Reverse all this for shorts).
This is where to be careful. The current bar is completed. You can't use its details to work out an exit price, even though you can see on the chart that your exit criteria are met. You have to wait for the next bar.
Next bar comes, you check if the low of the bar is below the stop loss level, and yes it is (probably). So it means your stop loss would have been taken out.
Thing #2 to be careful with is that you might need to use the open price of this new bar as the exit price, and not use where %sw = 0.5 as the exit price (it's possible you might want to use where %sw = 0.5 because programmatically that's what your stop loss would be set to).
It all depends if the price opened above or below the stop loss. In the example I'm talking about, most likely the open is below, we need to treat this like a gap down below the stop loss price. In this case we can't say that we got out at the stop loss price, but instead have to take whatever the market opened at.
If you personally were trading this live, the bar would close, Stormy would be calculated, where %sw would equal 0.5 would be calculated, and then you'd see that the price is actually below where you want to move your stop loss. Then you'd most likely exit at market. And you'd be doing that very close to the open of that next bar. That's why to use the open price as the actual exit price.
I'm sure you'd thought of this scenario already. It's possible I may have made this mistake at some point... :-)
» Post a Comment