The Weekend Wonder - 22/01/06
Hi all and I hope you weekend has been a relaxing one :)
Time for a review of the charts, and a look forward to Monday, remember, if you have not done so already, you can receive these reports every asian morning and sometimes other times, as well as trade alerts by subscribing to the yahoo service, instructions are here.
Ok first a review of Fridays activity. My suspicions as sent out to the Yahoo subscribers just before the opening of Europe proved be right this time, with the USD weakening through Europe and US trading, sending all the pairs into a 50-100 pip move. Here is how the charts looked at the time of analysis, i'll just show the EUR to keep things simple.
EUR/USD 1H (Opening of Europe)
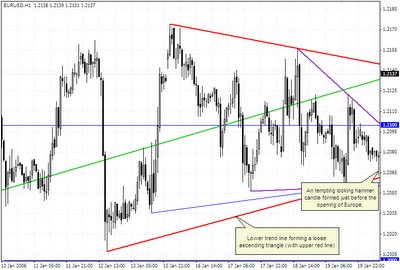
Ok let's have a look, in red, we have a loose ascending triangle, loose, because the upper trend line is sloping down, but not steep enough to make it an equalateral triangle formation. You can see at the far right of the chart, the last 1h candle formed was a hammer, a classical candlestick formation indicating short term rejection of lower prices. I'ts location close to the bottom of the triangle, the lack of real important eurozone data, and the week of rangebound trading, all stacked the odds in a rise off the bottom trend line, hence the alert.
Just for formatilities here is how things ended up:

Things, in the end moved up nicely, giving a very nice +60 odd trade if your stop loss was wide enough to avoid the spike low on London opening. This leads me onto what to watch Monday.
Have another look at the chart above, where has price finished? You will notice price is sitting right on the upper trend line forming that triangle I mentioned earlier, could be a coincidence as the markets closed, or could be a sign of weakness, only time will tell. What draws my attention to this one, is the point of confluence (intersection of lines) with the green line, which is the the median line drawn from the daily pivots.
If you are one to follow the theory that the EUR and GBP follow each other, here is where the GBP sits:
Ok let's have a look, in red, we have a loose ascending triangle, loose, because the upper trend line is sloping down, but not steep enough to make it an equalateral triangle formation. You can see at the far right of the chart, the last 1h candle formed was a hammer, a classical candlestick formation indicating short term rejection of lower prices. I'ts location close to the bottom of the triangle, the lack of real important eurozone data, and the week of rangebound trading, all stacked the odds in a rise off the bottom trend line, hence the alert.
Just for formatilities here is how things ended up:
EUR/USD 1H Friday close

Things, in the end moved up nicely, giving a very nice +60 odd trade if your stop loss was wide enough to avoid the spike low on London opening. This leads me onto what to watch Monday.
Have another look at the chart above, where has price finished? You will notice price is sitting right on the upper trend line forming that triangle I mentioned earlier, could be a coincidence as the markets closed, or could be a sign of weakness, only time will tell. What draws my attention to this one, is the point of confluence (intersection of lines) with the green line, which is the the median line drawn from the daily pivots.
If you are one to follow the theory that the EUR and GBP follow each other, here is where the GBP sits:
GBP/USD 1H Friday close
 Sitting just below a previous resistance that has held so far, pehaps they will follow after all. It is sitting just above 1.7700, a nice round number so we would want to see that broken to the downside to give us a hint things are heading back down.
Ok here is a quick summary of how I see things set up for Monday.
GBP/USD
Looking for 1H weakness around 1.7723. Ignore a break of this level if it is a result of prices gapping over the weekend, then look for weakness again. Need to see a 1H close below the round number of 1.7700 for a short position to be valid towards the mid 7600's.
EUR/USD
Sitting below a median line, trend line junction which could provide resistance, look for weakness in the move up, 1.2175 should cap long positions. If prices turn, look for profit taking around 1.2100 as we head towards the triangle apex.
USD/CHF
Take the lead off the EUR, should mirror the action pretty closely, i.e. take the opposite position on the CHF you read of the EUR for monday. No clear technical trade off the CHF apparent.
USD/JPY
May see a test of lower trend line around 115.10, look for this to hold on a 1H chart and go long targeting old uptrend line around 115.50 as a safer profit target, lock in profits if you can and go for higher. Do not enter a short position until you see 115.00 broken, preferable closed below.
This week is a week full of imporant data, the USD will drive most moves I think as usual. We are in for a volatile week with a bucket load of data in all areas, so be patient and calm and you could be in for a good week.
Happy trading!
This entry was posted
on Saturday, January 21, 2006 at 9:01:00 PM.
You can skip to the end and leave a response.
![]()
![]()
Posted bySunday, January 22, 2006 12:07:00 AM
How to draw median line in Metatrader?
Posted by
Sunday, January 22, 2006 12:23:00 AM
another name for median lines are Andrews' Pitchfork which is available in MT, have a look here for a brief explanation on how to draw them:
http://www.trade10.com/andrewspitchfork.htm
Posted by
Sunday, January 22, 2006 2:18:00 AM
I found another article about Andrews'Pitchfork for Forex. Hope it helps. :-)
http://www.investopedia.com/articles/forex/05/AndrewsPitchfork.asp
» Post a Comment