Theory: Trend Lines
Hi all!
Time for a new theory article, this time on a very basic, but incredibly usefull tool of trend lines. Now for Marketiva users, at present you cannot draw freehand trend lines on their charts, but I have it on good authority that this feature is not too far away, so you may need to look at some online charts or other charting packages to use this tool.
Trend lines form the basis of my trading system presently (along with support and resistance lines), and can give you a good insight into where prices are going, and in which direction. They can also be used to see when a trend might be breaking but I'll go into that a little later.
Ok first a chart from Friday just gone (click on it to see the animation):
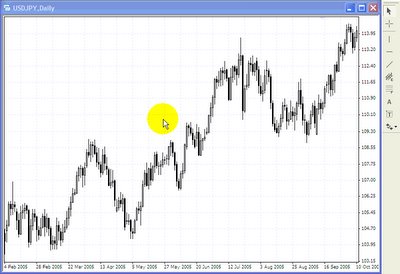
What you seeing here (click on the thumbnail to see it animate) is the USD/JPY daily chart, and on it I am drawing four different trend lines. In a down trend, i.e. when the price is making lower lows, and preferable lower highs, you draw your trend line across each peak, the opposite applies for an uptrend, where you draw a line across the troughs. Look at the above chart to see what I mean.
The basis of trend line studies, is to see what the overall trend is, and also to identify areas were the trend may be failing. In the above chart, there are four areas where a trend line was broken, in this case, you can see clearly that for a time the price then moved in the other direction, netting a very tidy profit if you read your exit correctly. Another way to trade using the trend lines is to use them to identify where the price may turn back towards the underlying trend, especially if it coincides with a support or resistance level, or a fibonacci line.
Now granted, that every trend line break does not prove to be valid, so be sure to confirm it with other tools, and I never consider a break of a trend line to be valid unless the prices closes outside the trend line on the timeframe my trend line was drawn on. You can draw trend lines on any timeframe, and a useful thing to do is draw your trend lines a timeframe or two above what you trade off, for example, if you trade off 1H charts, draw your trend lines from the 4H or daily charts. This will show you the underlying trend, and keep you in the right side of a trade more often than not.
Best of luck with this simple yet effective tool.
Happy trading!
Time for a new theory article, this time on a very basic, but incredibly usefull tool of trend lines. Now for Marketiva users, at present you cannot draw freehand trend lines on their charts, but I have it on good authority that this feature is not too far away, so you may need to look at some online charts or other charting packages to use this tool.
Trend lines form the basis of my trading system presently (along with support and resistance lines), and can give you a good insight into where prices are going, and in which direction. They can also be used to see when a trend might be breaking but I'll go into that a little later.
Ok first a chart from Friday just gone (click on it to see the animation):
What you seeing here (click on the thumbnail to see it animate) is the USD/JPY daily chart, and on it I am drawing four different trend lines. In a down trend, i.e. when the price is making lower lows, and preferable lower highs, you draw your trend line across each peak, the opposite applies for an uptrend, where you draw a line across the troughs. Look at the above chart to see what I mean.
... never consider a break of a trend line to be valid unless the prices closes outside the trend line ...
The basis of trend line studies, is to see what the overall trend is, and also to identify areas were the trend may be failing. In the above chart, there are four areas where a trend line was broken, in this case, you can see clearly that for a time the price then moved in the other direction, netting a very tidy profit if you read your exit correctly. Another way to trade using the trend lines is to use them to identify where the price may turn back towards the underlying trend, especially if it coincides with a support or resistance level, or a fibonacci line.
Now granted, that every trend line break does not prove to be valid, so be sure to confirm it with other tools, and I never consider a break of a trend line to be valid unless the prices closes outside the trend line on the timeframe my trend line was drawn on. You can draw trend lines on any timeframe, and a useful thing to do is draw your trend lines a timeframe or two above what you trade off, for example, if you trade off 1H charts, draw your trend lines from the 4H or daily charts. This will show you the underlying trend, and keep you in the right side of a trade more often than not.
Best of luck with this simple yet effective tool.
Happy trading!
This entry was posted
on Monday, November 21, 2005 at 11:40:00 AM.
You can skip to the end and leave a response.
![]()
![]()
» Post a Comment