Theory: Trading The News
Hi all,
Anyone who has traded for a while on the forex markets, will know that major drops and rises in a currency over a 1 hour perioud usually is a result of a news release somewhere in the world. The question that is always around, is how can you trade them, should you use technical analysis (study of charts only), or fundamental analysis (the study of economic indicators and news)?
Personally I try to use both, watching the news release compared to expectations, and then monitoring the charts to see the anticipated reaction, but let's look at the two extremes, trading a news release with only technical, or only fundamental.
Recently the European Central Bank released their interest rate figures, below is the 1H charts for the EURGBP, just before this release was made (you could look at the EURUSD or the EURJPY for exactly the same action):
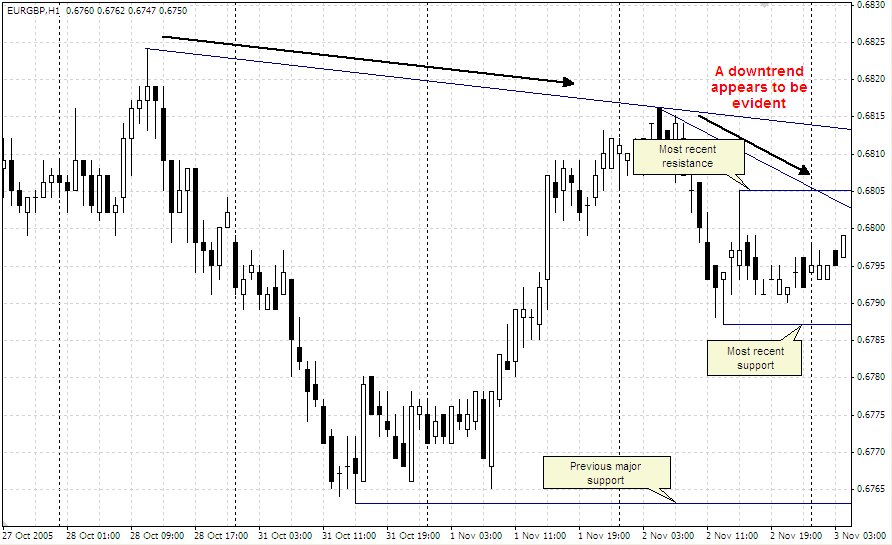
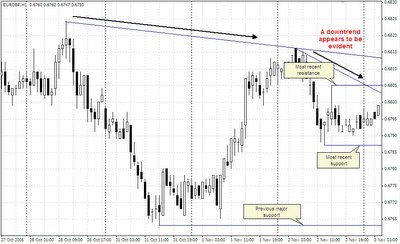 Now to trade this news announcement from a purely technical point of view. You can see from the above chart before the announcement was made, that the EURGBP seemed to be in a mid term and short term downtrend, as indicated by the trend lines. This would be the first indication of a possible direction. To aid us in identifying a significant move, I have drawn in the most recent support and resistance lines, we would be looking for one of these to be broken to indicate the move is underway.
So lets move now to the release of the news, remember we are looking for a break of either the resistance or support, if the support is broken, I would be more confident with my trade as it would maintain the current short and mid term trend;
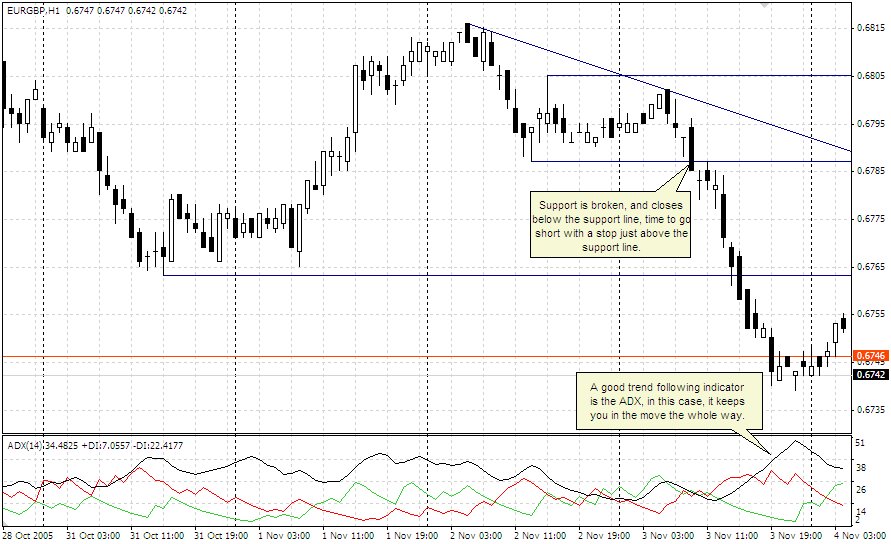
 Well there you go, support was indeed broken (like I didn't know), and a short position would have been opened, the trick then would have been to not get out of the move too early. How can this be done, I very rarely use indicators, but if there is one indicator I do use at times, it is the ADX (Average Directional Index) indicator. Abive you can see the black line, this is a guide to if a trend is in place, it will rise when there is one, and turn down when it thinks it is over. You can see, if you stayed in the trade until the ADX turned down, you would have ridden the move till the end.
So there you go, the news release traded purely with a very simple technical technique.
How about fundemental?, well I personally don't trade this way, but I would imagine this is how it would have been traded. Before the announcement was made on interest rates, the expectation was that they would be either raised (in which case attracting more investments into the EUR) or left the same. There was also an expectation that the speach accompanying the release would give a strong indication, that if they were not raised this time, a raise would not be far away.
So you are looking for two things, the initial announcement figure, and then the general message from the speach that followed. What happened in reality was that the interest rates were left as is, this made some people begin the sell off, the speach that followed was less "hawkish" or positive for a raise in interest rates soon than exepected which then sent the full sell off into full swing.
If you were to correspond this to the above charts, the initial announcement is the first hour candle that broke support, the speach was then the huge drops in the following two hours.
I hope that helps someone, and please comment on this if I have things wrong :)
Happy trading!
Anyone who has traded for a while on the forex markets, will know that major drops and rises in a currency over a 1 hour perioud usually is a result of a news release somewhere in the world. The question that is always around, is how can you trade them, should you use technical analysis (study of charts only), or fundamental analysis (the study of economic indicators and news)?
Personally I try to use both, watching the news release compared to expectations, and then monitoring the charts to see the anticipated reaction, but let's look at the two extremes, trading a news release with only technical, or only fundamental.
Recently the European Central Bank released their interest rate figures, below is the 1H charts for the EURGBP, just before this release was made (you could look at the EURUSD or the EURJPY for exactly the same action):
 Now to trade this news announcement from a purely technical point of view. You can see from the above chart before the announcement was made, that the EURGBP seemed to be in a mid term and short term downtrend, as indicated by the trend lines. This would be the first indication of a possible direction. To aid us in identifying a significant move, I have drawn in the most recent support and resistance lines, we would be looking for one of these to be broken to indicate the move is underway.
So lets move now to the release of the news, remember we are looking for a break of either the resistance or support, if the support is broken, I would be more confident with my trade as it would maintain the current short and mid term trend;
 Well there you go, support was indeed broken (like I didn't know), and a short position would have been opened, the trick then would have been to not get out of the move too early. How can this be done, I very rarely use indicators, but if there is one indicator I do use at times, it is the ADX (Average Directional Index) indicator. Abive you can see the black line, this is a guide to if a trend is in place, it will rise when there is one, and turn down when it thinks it is over. You can see, if you stayed in the trade until the ADX turned down, you would have ridden the move till the end.
So there you go, the news release traded purely with a very simple technical technique.
How about fundemental?, well I personally don't trade this way, but I would imagine this is how it would have been traded. Before the announcement was made on interest rates, the expectation was that they would be either raised (in which case attracting more investments into the EUR) or left the same. There was also an expectation that the speach accompanying the release would give a strong indication, that if they were not raised this time, a raise would not be far away.
So you are looking for two things, the initial announcement figure, and then the general message from the speach that followed. What happened in reality was that the interest rates were left as is, this made some people begin the sell off, the speach that followed was less "hawkish" or positive for a raise in interest rates soon than exepected which then sent the full sell off into full swing.
If you were to correspond this to the above charts, the initial announcement is the first hour candle that broke support, the speach was then the huge drops in the following two hours.
I hope that helps someone, and please comment on this if I have things wrong :)
Happy trading!
This entry was posted
on Tuesday, November 08, 2005 at 11:42:00 AM.
You can skip to the end and leave a response.
![]()
![]()
Posted byWednesday, November 09, 2005 3:18:00 PM
There is a popular strategy that people use to trade news especially Non-Farm Payroll. It is called straddle strategy. Trade short and long when price fluctuate largely. It can be very profitable but also vey dangerous. I only use it few times for NFP. :-)
Phildunn
» Post a Comment