Results, 21-25 Nov 2005
Ah another week gone by the wayside. It was a quiet week at times due to thanksgiving holiday on Thursday in the US, but Friday proved to be a little more active than expected to make up. I hope you all had a profitable week on the markets, thankfully my live calls proved to be profitable this week again, returning +159 pips, not quite as good as the 189 of the week before, but considering I sat Thursday out, not a bad week at all.
My own trades (remember I trade all live calls, plus some more speculative trades) were far from that positive, only coming in at +58 pips for the week, proving to me once again that the system I have developed is much smarter than my plain "interpretive skills" and should be stuck to!
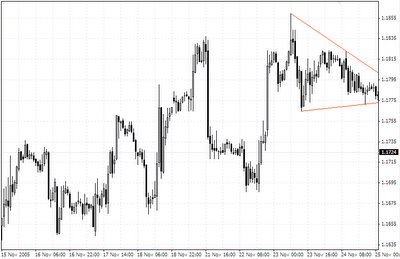
I'll draw your attention to Friday's European and US session, specifically one pattern I like trading, which was used for a live call during the US session. Let's have a look at the setup:
 You can see it is a very simple candlestick 1H chart, with two trendlines drawn in. These two trendlines form what is called a "descending triangle", i.e. the base of the triangle is pretty flat, while the upper part is sloping considerable down. This price pattern shows that traders are looking for a direction, as the push up is decreasing (lower high), yet support is not being broken (flat or slighty upsloping base).
So what we are looking for in this situation is a breakout of this pattern, either above or below the triangular trend lines. Now in a descending triangle, there is a greater chance of a breakout down, as the bulls seem to be weakening, but it is always best to wait for confirmation. Ok now let's look what happens:

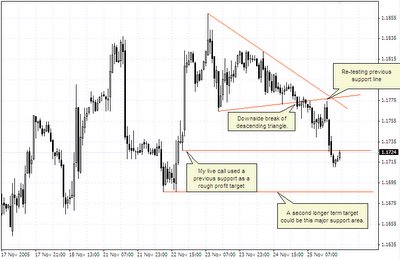
As suspected, the price broke below the lower support line, giving an indication of a strong move down in prices. From here there are two main ways to trade a triangle breakout, one, you can trade the breakout directly, in this case, going short as soon as a candle closes below the lower support. Another way is to wait for a retracement, when prices move back up to test the previous support line before moving back down again (called a "change in polarity", which in some strong moves doesn't always happen). This was the basis of my live call, although called slightly early, I placed a short trade near the support line, and we sat back and watched the price move down strongly in our favour. Our profit target was 1.1730, the round number just above a previous support at 1.1726 and it was acheived easily.
There are many more patterns that can be traded, and Ill be sure to do a theory article this week on some of the basic patterns most often seen.
I look forward to next week, after a very positive back test this weekend on my system that has given me full confidence on trading only based on this system. We are approaching the +1000 pip mark since Akumulate Pips came to being which is a nice milestone, let's hope it is acheived this week.
Happy trading!
This week's result: +58 pips | Overall: +980 pips
My own trades (remember I trade all live calls, plus some more speculative trades) were far from that positive, only coming in at +58 pips for the week, proving to me once again that the system I have developed is much smarter than my plain "interpretive skills" and should be stuck to!
I'll draw your attention to Friday's European and US session, specifically one pattern I like trading, which was used for a live call during the US session. Let's have a look at the setup:
 You can see it is a very simple candlestick 1H chart, with two trendlines drawn in. These two trendlines form what is called a "descending triangle", i.e. the base of the triangle is pretty flat, while the upper part is sloping considerable down. This price pattern shows that traders are looking for a direction, as the push up is decreasing (lower high), yet support is not being broken (flat or slighty upsloping base).
So what we are looking for in this situation is a breakout of this pattern, either above or below the triangular trend lines. Now in a descending triangle, there is a greater chance of a breakout down, as the bulls seem to be weakening, but it is always best to wait for confirmation. Ok now let's look what happens:

As suspected, the price broke below the lower support line, giving an indication of a strong move down in prices. From here there are two main ways to trade a triangle breakout, one, you can trade the breakout directly, in this case, going short as soon as a candle closes below the lower support. Another way is to wait for a retracement, when prices move back up to test the previous support line before moving back down again (called a "change in polarity", which in some strong moves doesn't always happen). This was the basis of my live call, although called slightly early, I placed a short trade near the support line, and we sat back and watched the price move down strongly in our favour. Our profit target was 1.1730, the round number just above a previous support at 1.1726 and it was acheived easily.
There are many more patterns that can be traded, and Ill be sure to do a theory article this week on some of the basic patterns most often seen.
I look forward to next week, after a very positive back test this weekend on my system that has given me full confidence on trading only based on this system. We are approaching the +1000 pip mark since Akumulate Pips came to being which is a nice milestone, let's hope it is acheived this week.
Happy trading!
This week's result: +58 pips | Overall: +980 pips
» Post a Comment