USD/JPY Triangle
Hi all,
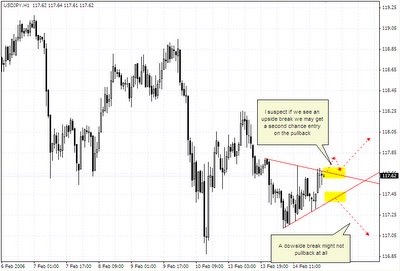
Just a quick one, as those subscribed to the alert service would know, we are watching the USD/JPY at the moment as it establishes a nice symmetrical triangle formation on the 1H charts. Here is the chart as we stand now:
Just a quick one, as those subscribed to the alert service would know, we are watching the USD/JPY at the moment as it establishes a nice symmetrical triangle formation on the 1H charts. Here is the chart as we stand now:
USD/JPY 1H


A symmetrical triangle such as this one indicates that the market is happy with price at the moment, and there is no clear bias one way or another. Of course the market is not happy for long and a new direction will be looked for, when it comes, the move should be decent. This pattern alone shows that the market is watching for tomorrow's speech by the new FED head honcho Bernanke, as most currencies are in holding patterns at the moment.
I will trade this triangle, going long or short based on a 1H close above or below this formation, I suspect it will break down but Ill let the price action tell me that and with such a quiet week and no real Yen data to talk of today, I suspect the move may not be as strong as hoped if it breaks out before Bernanke's speech at 3pm GMT.
I like triangles also as you can apply the measure rule for target setting, in this case the height of the base of the triangle is around 60 pips, so that will be how far my target will be from the break point. Like all things in fx, things can fake one way and go the other, but I have found triangles to be more reliable than most.
Happy trading!
Posted byWednesday, February 15, 2006 1:26:00 PM
Do u place stop orders on both breakout sides or watch it breakouts which way first?
Posted by
Wednesday, February 15, 2006 1:38:00 PM
As I want to see a close below or above, I can't place stop orders, as the price may move outside the triangle but get sucked back in, which is then time to re-draw the triangle and wait for a close again.
Posted by
Thursday, February 16, 2006 7:23:00 AM
Hi!
Great blog men! really interesting.
Could you maybe explain why FED's head speechs are so important and what are the mechanisms that makes the market react in a side or an other.
thx.
Paul
Posted by
Sunday, February 19, 2006 12:20:00 AM
Hi
Sorry for the question above, I red your blog entirely and I realized you already well explain everything about trading the news.
Again excellent blog. It makes me progress.
Paul
» Post a Comment