Stormy In Action
Hi all,
Just a quick update as we approach the end of today's Asian session. This morning was Stormy's first live run on the markets, with some pleasing results. At the moment I only have it tweaked for 15M charts, which are shorter than I personally would like to trade so there is some work to get things happening across all timeframes. The main reason is that there is very little warning of impending trades, to prove my point, here are two trades I missed this morning while I talking to a workmate:
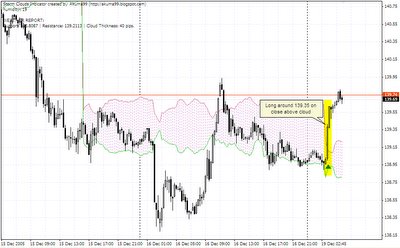
USD/JPY
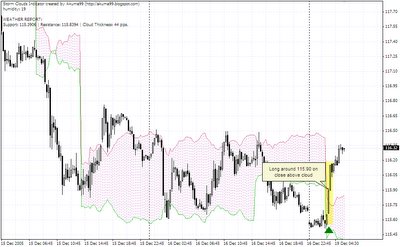
Just a quick update as we approach the end of today's Asian session. This morning was Stormy's first live run on the markets, with some pleasing results. At the moment I only have it tweaked for 15M charts, which are shorter than I personally would like to trade so there is some work to get things happening across all timeframes. The main reason is that there is very little warning of impending trades, to prove my point, here are two trades I missed this morning while I talking to a workmate:
EUR/JPY
USD/JPY
So another good sign for Stormy, but until I can get it working on a 1H and 4H chart, personally I will not be trading it live just yet. If you are a short term trader though, it might be right up your alley in it's current form. You can also see, that in ranging periods, such as seen in the USD/JPY on Friday, I haven't got it quite right (although close), with 3 fake signals given. Ideally I would like to see those contained within the cloud (which they almost were) which would have removed those signals as well as allow me to develop a ranging strategy (sell at a turn at the top of a cloud, buy at a turn at the bottom).
I will give it a real good thorough run in the US session tonight when I can devote some time to monitoring the trades, in the meantime, best of luck with all your trades.
Happy trading!
I will give it a real good thorough run in the US session tonight when I can devote some time to monitoring the trades, in the meantime, best of luck with all your trades.
Happy trading!
This entry was posted
on Monday, December 19, 2005 at 2:40:00 PM.
You can skip to the end and leave a response.
![]()
![]()
Posted byMonday, December 19, 2005 7:25:00 PM
Congrats !:D This signals give good entry but how u determine the stop-loss and exit?
Posted by
Monday, December 19, 2005 11:37:00 PM
This is part of what I am working on, a simple system can be to take the opposite side of the cloud as a moving stop loss, and the thickness of the cloud as a profit target (added to the top of the cloud for long, bottom for short).
It is something I am investigating.
Posted by
Tuesday, December 20, 2005 8:05:00 AM
Hi akuma,
first congratulation on your blog. I'm writing my own (globetrader.blogspot.com) and your's sure has great ideas and advice, you don't find easily elsewhere.
Reading through your articles (I read your technical analysis aricles today) you introduced me to the ADX, an indicator I so far have not used as it isn't one, you can easily read (at least I can't).
In my trading I have removed all oscillators as imho they all can be replaced with a Line on Close chart, which gives the same information, just faster and which I have now placed below a candlestick chart.
Adding the ADX today I see, that it might have information, I don't get from a LoC chart and it might be worth learning to read it.
Seeing your Stormy indicator it reminds me of the ADX, just transferred on price. It seems to be that the band is formed around a longer moving average using the ADX Up-/ Down Index to calculate a kind of volatility or percentage band.
I don't know, if you want to keep the formula proprietary or not, I would just like to know, if my idea how you create the band is on the right track.
Living in Germany I don't know if I will meet you in Marketiva Chat, as out TZ's are nearly 12h apart, but who knows.
Posted by
Tuesday, December 20, 2005 10:42:00 AM
Hi there globetrader and thanks for the great comment, just had a look at your blog and it seems like you have put a lot of effort into it also, great work!
You analysis of the Stormy indicator is very interesting, at the moment a I am keeping the formula close to my chest as I put the work into it, but I can say that the ADX is not used for it, however your observations on volatility is on the right track :)
I am (sadly) online most of the day and night at the moment so I will look out for you in the chat rooms. Thanks again for some very interesting insight.
Posted by
Tuesday, December 20, 2005 3:48:00 PM
May I know why u call your indicator as Stormy? Market is like weather,always changing? :D
Posted by
Tuesday, December 20, 2005 6:29:00 PM
I think I know the answer. The chart looks like lightning in the clouds... :-)
Posted by
Tuesday, December 20, 2005 7:55:00 PM
Pretty much right, the indicator forms clouds of various thicknesses, just like a storm, still I am also working on a companion indicator coded "Acid Rain" which you can imagine might look like but that will come later.
Posted by
Tuesday, December 20, 2005 11:36:00 PM
Hi akuma,
playing around a bit with ADX and as I'm such a sloppy guy, loving it KISS and ADX really requires thinking instead of just looking, I was looking this morning for ways to reformat ADX in something I'm used to.
So I thought, why not reduce it to 1 line instead of 3, which should tell me at a glance
1. If we are up- or down trending
2. if there is a strong trend or consolidation.
I'm used to see an indicator below the 50% or zero line if we are downtrending and above in a uptrend, as every oscillator is showing this behaviour.
Also the higher/lower the value of the indicator the stronger the trend (true for STO or RSI at least, not necessarily for CCI), the nearer to the zero line the clearer the indication of a consolidation.
To get that from the ADX I calculated
X:= (Up Index - Down Index) * ADX value
This gives you a not normalized indicator, which in a downtrend is below zero and above in an uptrend. Also the stronger the trend the higher the indicator value becomes.
On this chart (http://charts.dacharts.com/2005-12-20/Globetrader_96.png) in the lowest subchart you see the resulting indicator in light blue. It might be possible to trade this indicator in itself, but it seems to be a bit messy, so I added a 5,3,3 Stochastic calculated from these values to smooth it (the red, green line) and will now test, if it isn't possible to get nice entries and exits from this indicator.
I posted this here, as you gave me the idea to play with the ADX and you are constructing indicators yourself, so you might be able to point out errors in my thinking when constructing this indicator.
Posted by
Wednesday, December 21, 2005 2:47:00 AM
hello
your blog is very good , pls keep the good work,
please would you kindly give explanation on how you trade the storm, the make up, the entry and exit
thanks
michael
Posted by
Wednesday, December 21, 2005 3:09:00 PM
No indicator is perfect but it can be profitable if the indicator can always get >50% right with good money management. With good risk/reward ratio,for example 3:1, we put stop loss +/-30 and target profit +/- 90 pips. We can earn consistently in long term.
There is more great explaination about money management here. Hope I can help u. :-)
http://babypips.com/forex-school/money-management.html
Posted by
Wednesday, December 21, 2005 3:35:00 PM
Globetrader, some very interesting thoughts there on refining the ADX into an oscilating indicator. You say that the higher the value the stronger the trend in the direction of the slope, this seems easy to interpret, what would be your rule of entry? a cross over of the 20 line as per the traditional use of ADX or something different?
» Post a Comment