Theory: Pivot Points
Ok, it seems there are a whole bunch of people asking about Pivot Points in the chat room of Marketiva, so I thought Ill give you the theory on it, and let you all work out how to trade it. I know of a few professional traders who use pivots in their trading system, and there are a few on Marketiva as well, myself and peterb are two who come to mind.
Alright so here we go.
Pivot Points are interesting guides, and in a sense they are reliant on people using them for them to work, a self-fulfilling indicator in a way, well at least that is the way I see them. Pivot Points are worked our from the previous days, High (H), Low (L) and Closing (C) values. From these values we generate five different values, the Pivot Point (P), Support 1 (S1), Support 2 (S2), Resistance 1 (R1) and Resistance 2 (R2). Some also include a Support 3 and Resistance 3 but I can't remember the formulas for those :). Now I don't pretend to understand why the formula's are as they are but in case anyone has the urge to know, here they are:
Rather than just spit you out a text book explanation of what these are used for, you can get that from a simple google search, this is how I have observed them so far.
The Pivot Point are supposed to identify an "equilibrium" point, a level that prices could gravitate back towards during a days trading. Personally though I think the two most important levels to take note of are the first Support and Resistance points, R1 and S1. As prices move towards these levels, you almost always see a pause in the move, sometimes even a reversal. So if you are in a trade and are nervous about its movement continueing, a good place to re-evaluate your position is as prices move towards these points.
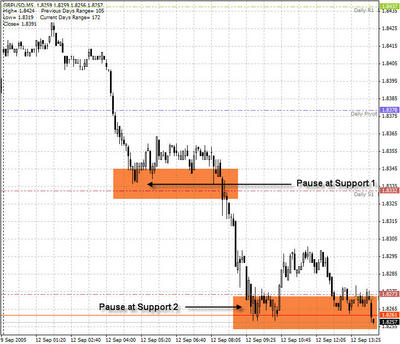
If you are looking for a reversal, these are also good points to look at your indicators, and if they are showing signs of a reversal, the nearby support or resistance point should give you some extra confidence. Be careful though, as there are occasions where the price is merely pausing as it approaches or hits this significant point, before moving on with the current trend.
So in summary pivots:
I don't know if that makes things any clearer or not, but that is my understanding. You can use an online pivot point calculator here at fxstreet, or download one for your desktop here.
Alright so here we go.
Pivot Points are interesting guides, and in a sense they are reliant on people using them for them to work, a self-fulfilling indicator in a way, well at least that is the way I see them. Pivot Points are worked our from the previous days, High (H), Low (L) and Closing (C) values. From these values we generate five different values, the Pivot Point (P), Support 1 (S1), Support 2 (S2), Resistance 1 (R1) and Resistance 2 (R2). Some also include a Support 3 and Resistance 3 but I can't remember the formulas for those :). Now I don't pretend to understand why the formula's are as they are but in case anyone has the urge to know, here they are:
R2 = P + (H - L) = P + (R1 - S1)
R1 = (P x 2) - L
P = (H + L + C) / 3
S1 = (P x 2) - H
S2 = P - (H - L) = P - (R1 - S1)
Rather than just spit you out a text book explanation of what these are used for, you can get that from a simple google search, this is how I have observed them so far.
The Pivot Point are supposed to identify an "equilibrium" point, a level that prices could gravitate back towards during a days trading. Personally though I think the two most important levels to take note of are the first Support and Resistance points, R1 and S1. As prices move towards these levels, you almost always see a pause in the move, sometimes even a reversal. So if you are in a trade and are nervous about its movement continueing, a good place to re-evaluate your position is as prices move towards these points.
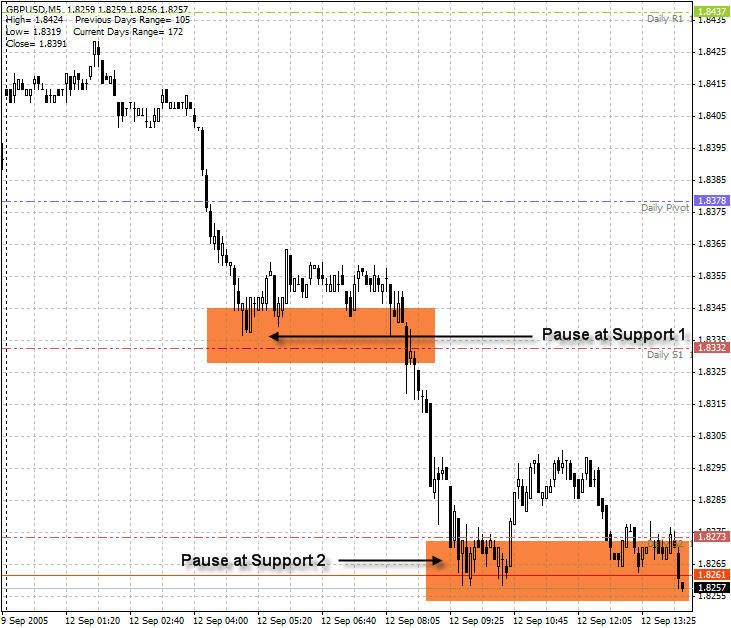
If you are looking for a reversal, these are also good points to look at your indicators, and if they are showing signs of a reversal, the nearby support or resistance point should give you some extra confidence. Be careful though, as there are occasions where the price is merely pausing as it approaches or hits this significant point, before moving on with the current trend.
So in summary pivots:
- Show predicted ranges for the prices movement of the day
- Give indications of where prices might pause
- Give indications of where prices might reverse
I don't know if that makes things any clearer or not, but that is my understanding. You can use an online pivot point calculator here at fxstreet, or download one for your desktop here.
This entry was posted
on Monday, September 12, 2005 at 9:48:00 PM.
You can skip to the end and leave a response.
![]()
![]()
Posted bySunday, June 04, 2006 9:07:00 AM
Thanks for all the great information. There is also a pivot point calculator here that I have been using which has a few more options than the fxstreet one that you refer to:
http://www.pivotpointcalculator.com/
Thanks again.
John C.
Posted by
Saturday, June 10, 2006 5:44:00 PM
great blog...great info aboout pivot. I want to ask if u could explain the murray i mean what actually murray mathss? is that same principal with pivot?
thanks
» Post a Comment