Results, 28 Sept 2005
Hi all! and I hope you are all having a good start to a new trading day.
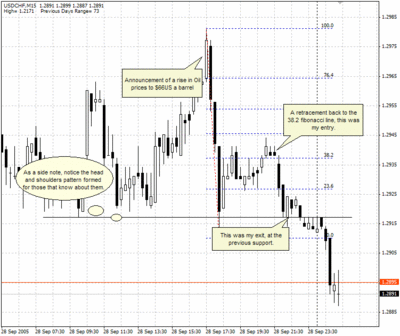
I am sure there will be many people who made a lot of money yesterday, with some very good runs establishing around news events, one notable one being the increase of oil prices, combined with with some underlying weakness in the USD later saw the USD dropping against all currencies late in the US session. Personally I wasn't around to catch that, but I did catch it's second drop after the retracement. To show you what I mean here is the trade as today's trade of the day.
Trade of the day:
 Ok so here is the trade, notice the sharp powerful drop, which would have been a very fast and profitable trade had you caught it's top. Notice though, that despite its drastic drop, it paused and reversed around the previous support, showing the value of support and resistance lines for exit targets. I logged in just as the move reached this support line, so I was watching to see if a retracement (a smaller move in the opposite direction to the main move), was going to happen.
The method I like to use to find where these retracements might stop, is fibonacci lines. I will be sure to write an article on fibonacci some time soon. Anyhow, so around the 38.2 fibonacci line, you can see there was a series of three inverted hammers, all in a row, this was a strong sign to me of a last effort to push the price higher but failing, the last two hammers being black (closing lower than the open) gave me more confidence the move was about to resume. As you can see after that, the move did resume, and I exited around the previous support for a 14 pip profit.
There are many confused comment in the chat rooms when this type of action occurs, but remember, all moves must rest at some point, kind of like a period of refuelling, and almost all moves will do this. The good thing about this can be that it offers a second chance to enter the move, the trick is to identify when the retracement is finishing.
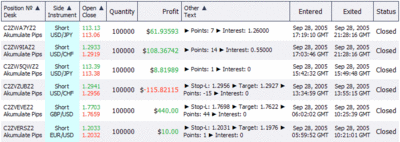
Ok now for today results over all, a good day, much more solid than yesterday with a good return, here is the list of trades:
 So that is it for today, coming up will be an article on Fibonacci, and some links to some great resources that I am sure will be of some use to you all.
Happy trading!
Today's result: +52 pips | Overall: +74 pips
I am sure there will be many people who made a lot of money yesterday, with some very good runs establishing around news events, one notable one being the increase of oil prices, combined with with some underlying weakness in the USD later saw the USD dropping against all currencies late in the US session. Personally I wasn't around to catch that, but I did catch it's second drop after the retracement. To show you what I mean here is the trade as today's trade of the day.
Trade of the day:
 Ok so here is the trade, notice the sharp powerful drop, which would have been a very fast and profitable trade had you caught it's top. Notice though, that despite its drastic drop, it paused and reversed around the previous support, showing the value of support and resistance lines for exit targets. I logged in just as the move reached this support line, so I was watching to see if a retracement (a smaller move in the opposite direction to the main move), was going to happen.
The method I like to use to find where these retracements might stop, is fibonacci lines. I will be sure to write an article on fibonacci some time soon. Anyhow, so around the 38.2 fibonacci line, you can see there was a series of three inverted hammers, all in a row, this was a strong sign to me of a last effort to push the price higher but failing, the last two hammers being black (closing lower than the open) gave me more confidence the move was about to resume. As you can see after that, the move did resume, and I exited around the previous support for a 14 pip profit.
There are many confused comment in the chat rooms when this type of action occurs, but remember, all moves must rest at some point, kind of like a period of refuelling, and almost all moves will do this. The good thing about this can be that it offers a second chance to enter the move, the trick is to identify when the retracement is finishing.
Ok now for today results over all, a good day, much more solid than yesterday with a good return, here is the list of trades:
 So that is it for today, coming up will be an article on Fibonacci, and some links to some great resources that I am sure will be of some use to you all.
Happy trading!
Today's result: +52 pips | Overall: +74 pips
» Post a Comment